26 Eylül 2021 Pazar

2D Heat Equation Solver

My least weekend project. A javascript simulation of 2D heat diffusion. Vanilla JS. Source code is here


9 Mayıs 2021 Pazar

Principle Component Analysis for Stock Markets


PCA application sample for analysis of stock markets using python

Click Here For GitHub Page


PCA is a mathematical method for compressing multidimensional data into a less dimensional version. That data reduction helps to make analysis more simpler. More information about principle component analysis and its math is  here. With this project I tried to analyse stock market data with PCA decomposition.


# Data

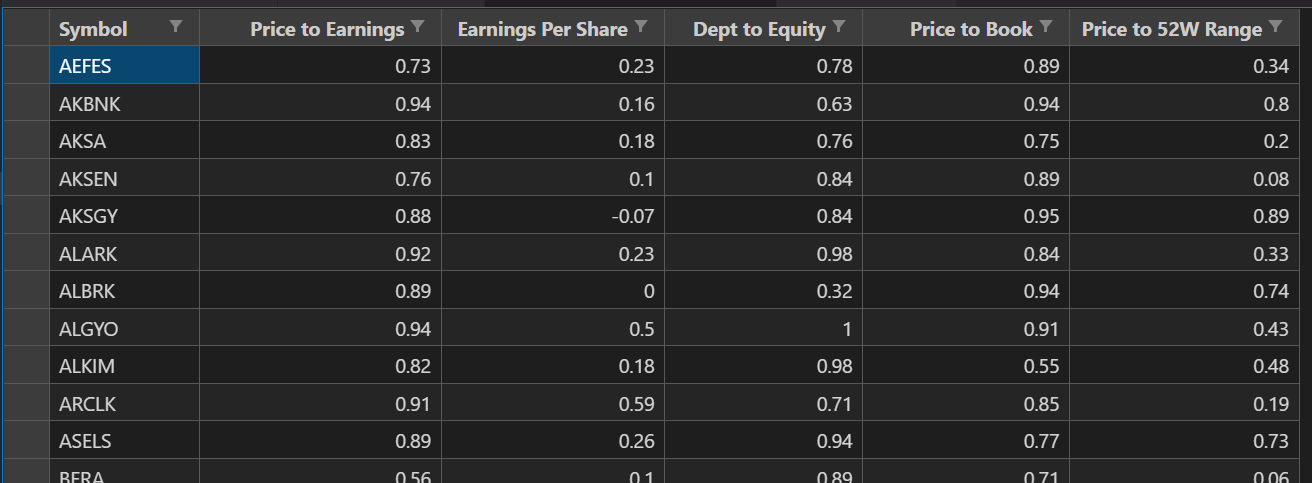
I used "Borsa Istanbul 100" a.k.a. "Bist100"  stock market index symbols. It is an index of Turkey stocks that covers top 100 biggest components. Gathered 5 basic financial ratios  for each symbol around internet and here is the raw result (ticks.raw.csv):


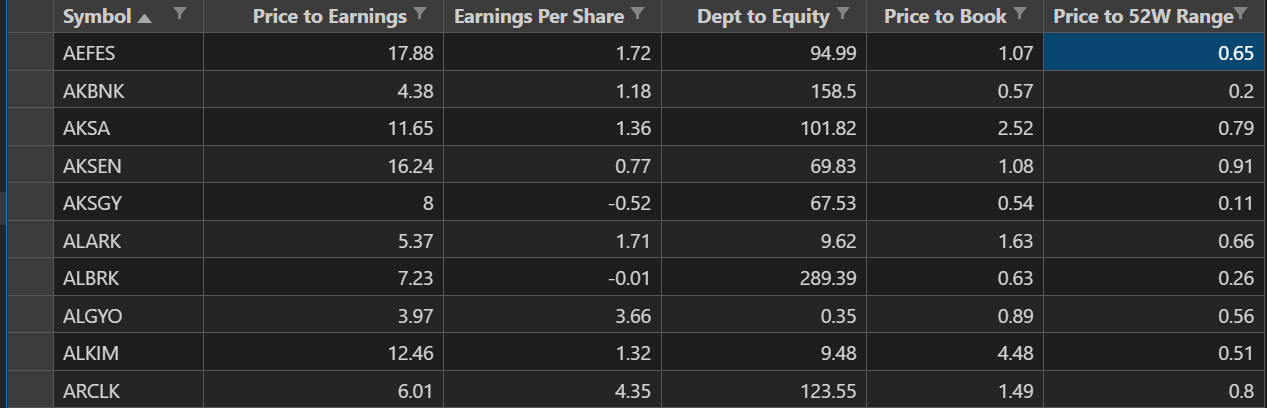
These are some common financial indicators to measure fair price of a company. I picked 5 of many indicators which i wanted in my sample analyse. Different choices made among the indicators will change the whole result.Therefore, it is important to make the right choices.  Raw data columns has various ranges. For instance price to earning range is 1.43 to 244.74 and price to book value range is 0.29 to 30.51. Too much numerical difference between columns affects their impact on the result which is not wanted. Thats why applied following steps to balance them:

  • Normalize each ratio indicator in its own column to fit 0 to 1
  • Crop extreme high/lows fixed limit
  • After normaliztion 1 should be the best and 0 should be the worst value for each column but for some ratios lower value is better. For price to book value,dept to equality,price to book, price to 52W range lower is better. Therfore subtracted their normalized value from 1 for these columns


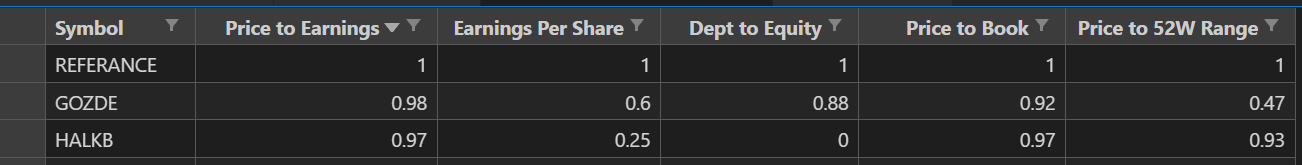
Here is the result (ticks.norm.csv):


Afer data fetch and normalization I pushed an other single row to final data. It is "Referance"  point. An imaginary stock with perfect ratios. All the indicators equals to 1. That point will help me to figure out better stocks after PCA decomposition.


# PCA

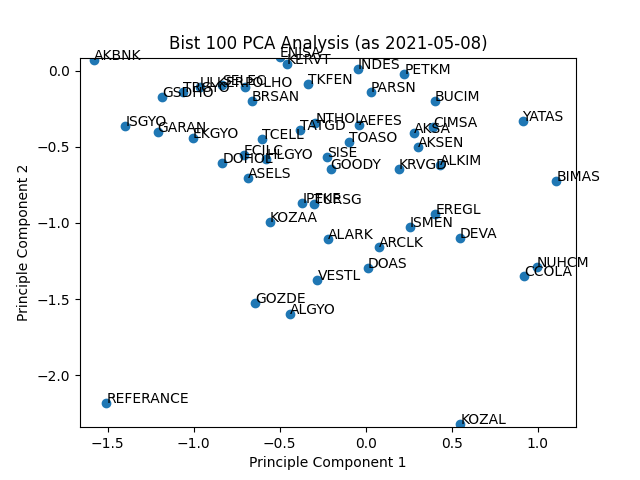
Raw data contains one label dimension (symbol column) and 5 feature dimensions. With PCA calculation, reduced that information to 2 component dimentions. These dimentions contains primary characteristic information of whole 6 dimention data. Sklearn liblary has built in PCA tools to make that happened. Pandas and matplotlib will help to visualize reduced data in scatter plot. These steps in pca.py file. Here is the result plot:


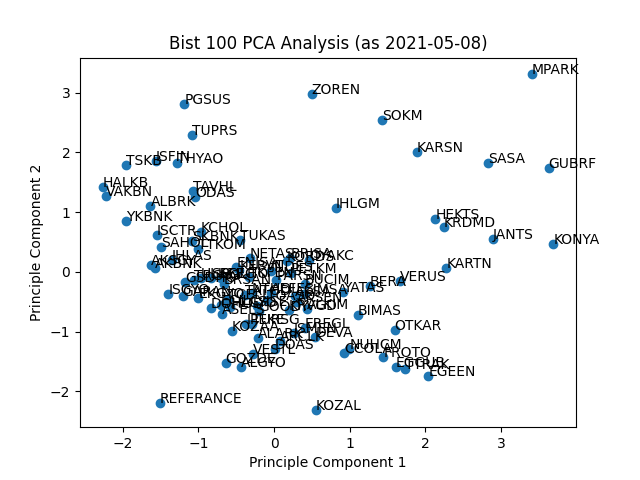
Closer to Referrance point means  better results:


14 Şubat 2020 Cuma

Javascript Lightning Effect

My recent javascript experiment that i build for fun. It generates lightning effect on canvas. Full source code available at github.


28 Aralık 2019 Cumartesi

Tensorflow Gender Detector

Here is my last Tensorflow experiment. A convolutional neural network implementation sample that detect human genders via Tensorflow and Keras.

Souce code
https://github.com/diwsi/Tensorflow-Gender-Detector

Training Data
I used https://www.kaggle.com/playlist/men-women-classification for training data. Removed useless pictures, cropped from center as square shape and resized to 128x128 pixels.

Network Model
Tensorflow keras network contains 4 convolutional layers with 3 by 3 filters. Has somoe dropout between dense layers to prevent overfitting. (trainer.py)


Training
"Sparse Categorical Crossentropy" for loss funtion with adam optimizer over 50 epochs. (trainer.py)


Prediction
After training completed here is the result of test images (predictor.py)


f1.jpg Woman:99% Man:0%
f2.jpg Woman:99% Man:0%
f3.jpg Woman:99% Man:0%
f4.jpg Woman:99% Man:0%
f5.jpg Woman:99% Man:0%
f6.jpg Woman:100% Man:0%
m1.jpg Woman:43% Man:56%
m2.jpg Woman:0% Man:99%
m3.jpg Woman:0% Man:99%
m4.jpg Woman:28% Man:71%
m5.jpg Woman:2% Man:97%
m6.jpg Woman:99% Man:0%
m7.jpg Woman:0% Man:99%
m8.jpg Woman:0% Man:99%
m9.jpg Woman:0% Man:100%

1 Mayıs 2017 Pazartesi

Genetic Algorithm vs Travelling Salesman Problem

 Download demo source code HERE.

Travelling salesman problem (TSP) a NP-hard problem. A salesman must visit a certain number of cities only for once and return to start position. What is the shortest route? It is a popular problem on mathematical optimisations and computer science. Genetic algorithm is a metaheuristic method to resolve problems that inspired by biological evolution process. I tried to resolve TSP by genetic algorithm. I used pure javascript and html. Here its steps and how I applied them to the TSP.

1.Initialization
First, we need to create population. Each individual of the population is random route. To mimic biological processes, each individual must have a gene. Chromosome base on solution of problem and on TSP situation a gene is an array of city list.

2.Selection
Nature has an elimination system called 'Natural Selection'. Stronger members of the population survive and breed. Genetic algorithm uses a function called 'Fitness Function' to find out strongest individuals. The fitness function is not a generic function. It is determined by the developer based on the problem. In TSP case my fitness function measures the length of the route. Individuals with lower length route are stronger. I select top individuals, keep and breed them and replace with weaker ones. 
Here is my fitness function.

3.Genetic Operations
Chromosomal crossover is an exchange of genetic material. Nature creates better genes by using stronger parts of two different chromosomes.


 In the genetic algorithm approach I sorted population by fitness (length of the route) and apply crossover to create shorter route:
  1. Select a pair of solution (route). Each solution is an index  array of city points.
    Mate 1:
    Mate 2: 
  2.  Select a random point and slice Mate 1:
  3. Fill rest of the sliced Mate 1 array by using Mate 2:
  4. Here is the new solution (child):
New children populeted this way probably will have better finess result.

4.Mutation
Some mutations create crippled creatures, but some mutations are next jump in evaluation tree. Mutation adds dynamism to the population and breaks, repeating crossover loops. I added mutation if genes in pair of solution are same. Just swapped two random indices.


Mutates to


The working implemantation is down below. Also here is he github page.